Water Pollution in Minotola, NJ that effected the residential citizens and businesses nearby in the 1980s
by Iona Smith
Site Description:
Minotola, NJ is a small city located in Atlantic County. The racial population consists of 82% White, 10.3% African American, Hispanic 13.3%, Indian 2.7%, and other races that are less than 2%. South Jersey Clothing Company is a store that was located on 1 Central Ave in Minotola, NJ. The company operated from the 1940s to the 1980s. It produced military uniforms and dry cleaned them. However, The South Jersey Clothing Company produced hazardous chemicals in their dry-cleaning wastewater called tetrachloroethylene and trichoichloroethylene that were dumped on the ground then into the soil, then into the water. This catastrophic event affected other businesses nearby and the residential citizens drinking water supply. NJDEP launched an investigation and found that the water was contaminated with high levels of tetrachloroethylene and trichoichloroethylene 12,000 parts per billion. This discharge of the waste was done without the consent of NJDEP. South Jersey Clothing Company has been dumping its waste without the permission of NJDEP from 1972 to 1981. Who was affected and how? The local residents were affected considering that it contaminated their drinking water. Other establishments nearby were affected considering that they had to close their stores. What do local community people do to try and fight back? The community became involved and a lawsuit was filed against South Jersey Clothing Company. What is the larger significance? The larger significance is that scholars such as Robert Bullard, Andrew Hurley & Max Liboiron argue that environmental injustice does not occur in white residential areas. My research shows that environmental injustice does occur in white residential areas.
Primary Sources:
Orr, Scott J. “EPA ready to add 10 Jersey tracts to superfund cleanup priority list”. Star Ledger, April 14,1988, Location: Newark Public Library
Scott Orr is a reporter for the Star Ledger Newspaper. He addresses the concerns from Senator Lautenberg about the superfund budget from the federal government to clean up the toxic waste in the State of New Jersey. The reporter describes that South Jersey Clothing Store being irresponsible for the contamination of the residential drinking water in Minotola, NJ. This article will help me understand the environmental injustice that occurred and how the federal government is intervening to address the issue.
“South Jersey Clothing Company”. Atlantic County Index of Sites, Location: Newark Public Library
The Atlantic County Health Department took samples of water from the South Jersey Clothing Company for about roughly four years. The counties investigation revealed that South Jersey Clothing Company water was contaminated.
“Health Assessment for Garden State Cleaners Company, CERCLIS No. NJD053280160” & South Jersey Clothing Company CERCLIS No. NJD980766828, Minotola, Atlantic County, New Jersey
Location: Newark Public Library
This report contains information about toxic substances that was discovered by NJDEP at responsible industry locations. This report will help me understand what contributed the pollution of Minotola, NJ.
U.S. Environmental Protection Agency Region II, “Superfund Five-Year Review Report South Jersey Clothing Company and Garden State Cleaners Sites Buena Borough, Atlantic County, New Jersey “file:///P:/Downloads/vdocuments.net_superfund-five-year-review-report-south-jersey-clothing-under-the-current-site%20(1).pdf
This report was prepared from the US EPA. This report contains a five year review “is to assure that implemented remedies protect public health and the environment and that they function as intended by the decision documents” US EPA. This report will help me understand why South Jersey was put on the Superfund List to clean up the toxic waste that was produced by industries.
US EPA, “South Jersey Clothing Co. Minotola, NJ” https://cumulis.epa.gov/supercpad/SiteProfiles/index.cfm?fuseaction=second.Cleanup&id=0200803#bkground
This article talks about the background of South Jersey Clothing Company including the waste, clean up and the new take over. This article will help me understand how the pollution was created and what was done to help clean it up.
Secondary Sources:
Barbara Glenn, Ravi P. Subramaniam, Maureen R. Gwinn, Rebecca C. Dzubow, and Weihsueh A. Chiu, Karen A. Hogan, Cheryl Siegel Scott, Glinda S. Cooper, Ambuja S. Bale, Leonid Kopylev, Stanley Barone Jr., Susan L. Makris, Kathryn Z. Guyton. 2014. “Human Health Effects of Tetrachloroethylene: Key Findings and Scientific Issues.” Environmental Health Perspectives Pages 325-334. https://ehp.niehs.nih.gov/doi/full/10.1289/ehp.1307359
This article deliberately found and cited the human effects of Tetrachloroethylene. Tetrachloroethylene is also known as PCE. The paper provides me information about the usage of PCE and its detrimental effects. This is an environmental injustice toxic that I am familiar with.
Berit Bakke, Patricia A. Stewart & Martha A. Waters. 2007. “Uses of and Exposure to Trichloroethylene in U.S.” Journal of Occupational and Environmental Hygiene 375-390 . https://www.tandfonline.com/doi/full/10.1080/15459620701301763
This research article contains information about the exposure to Trichloroethylene also known as TCE. This information will provide me with information about how people are exposed to TCE by US Industry Employment factors.
Elana R. Elkin, Dave Bridges, Sean M. Harris, and Rita Karen Loch-Caruso. 2020. “Exposure to Trichloroethylene Metabolite S-(1,2-Dichlorovinyl)-L-cysteine Causes Compensatory Changes to Macronutrient Utilization and Energy Metabolism in Placental HTR-8/SVneo Cells.” Chemical Research in Toxicology 1339–1355. https://pubs.acs.org/doi/abs/10.1021/acs.chemrestox.9b00356
This research article contains expert knowledge about the toxicology of chemical research about TCE exposure. This source of information provides with affect of environmental and human exposure of TCE.
Laura S. Gold, Anneclaire J. De Roos , Martha Waters & Patricia Stewart. 2008. “Systematic Literature Review of Uses and Levels of Occupational Exposure to Tetrachloroethylene.” Journal of Occupational and Environmental Hygiene 807-839. https://www.tandfonline.com/doi/full/10.1080/15459620802510866
This research article consists of information about Tetrachloroethylene and what it is used for. This article will give me a closer insight of Tetrachloroethylene usages and damages. It will also provide me with the environmental injustice it has caused.
Image Analysis:
South Jersey Clothing Company (Federal EPA 1997)
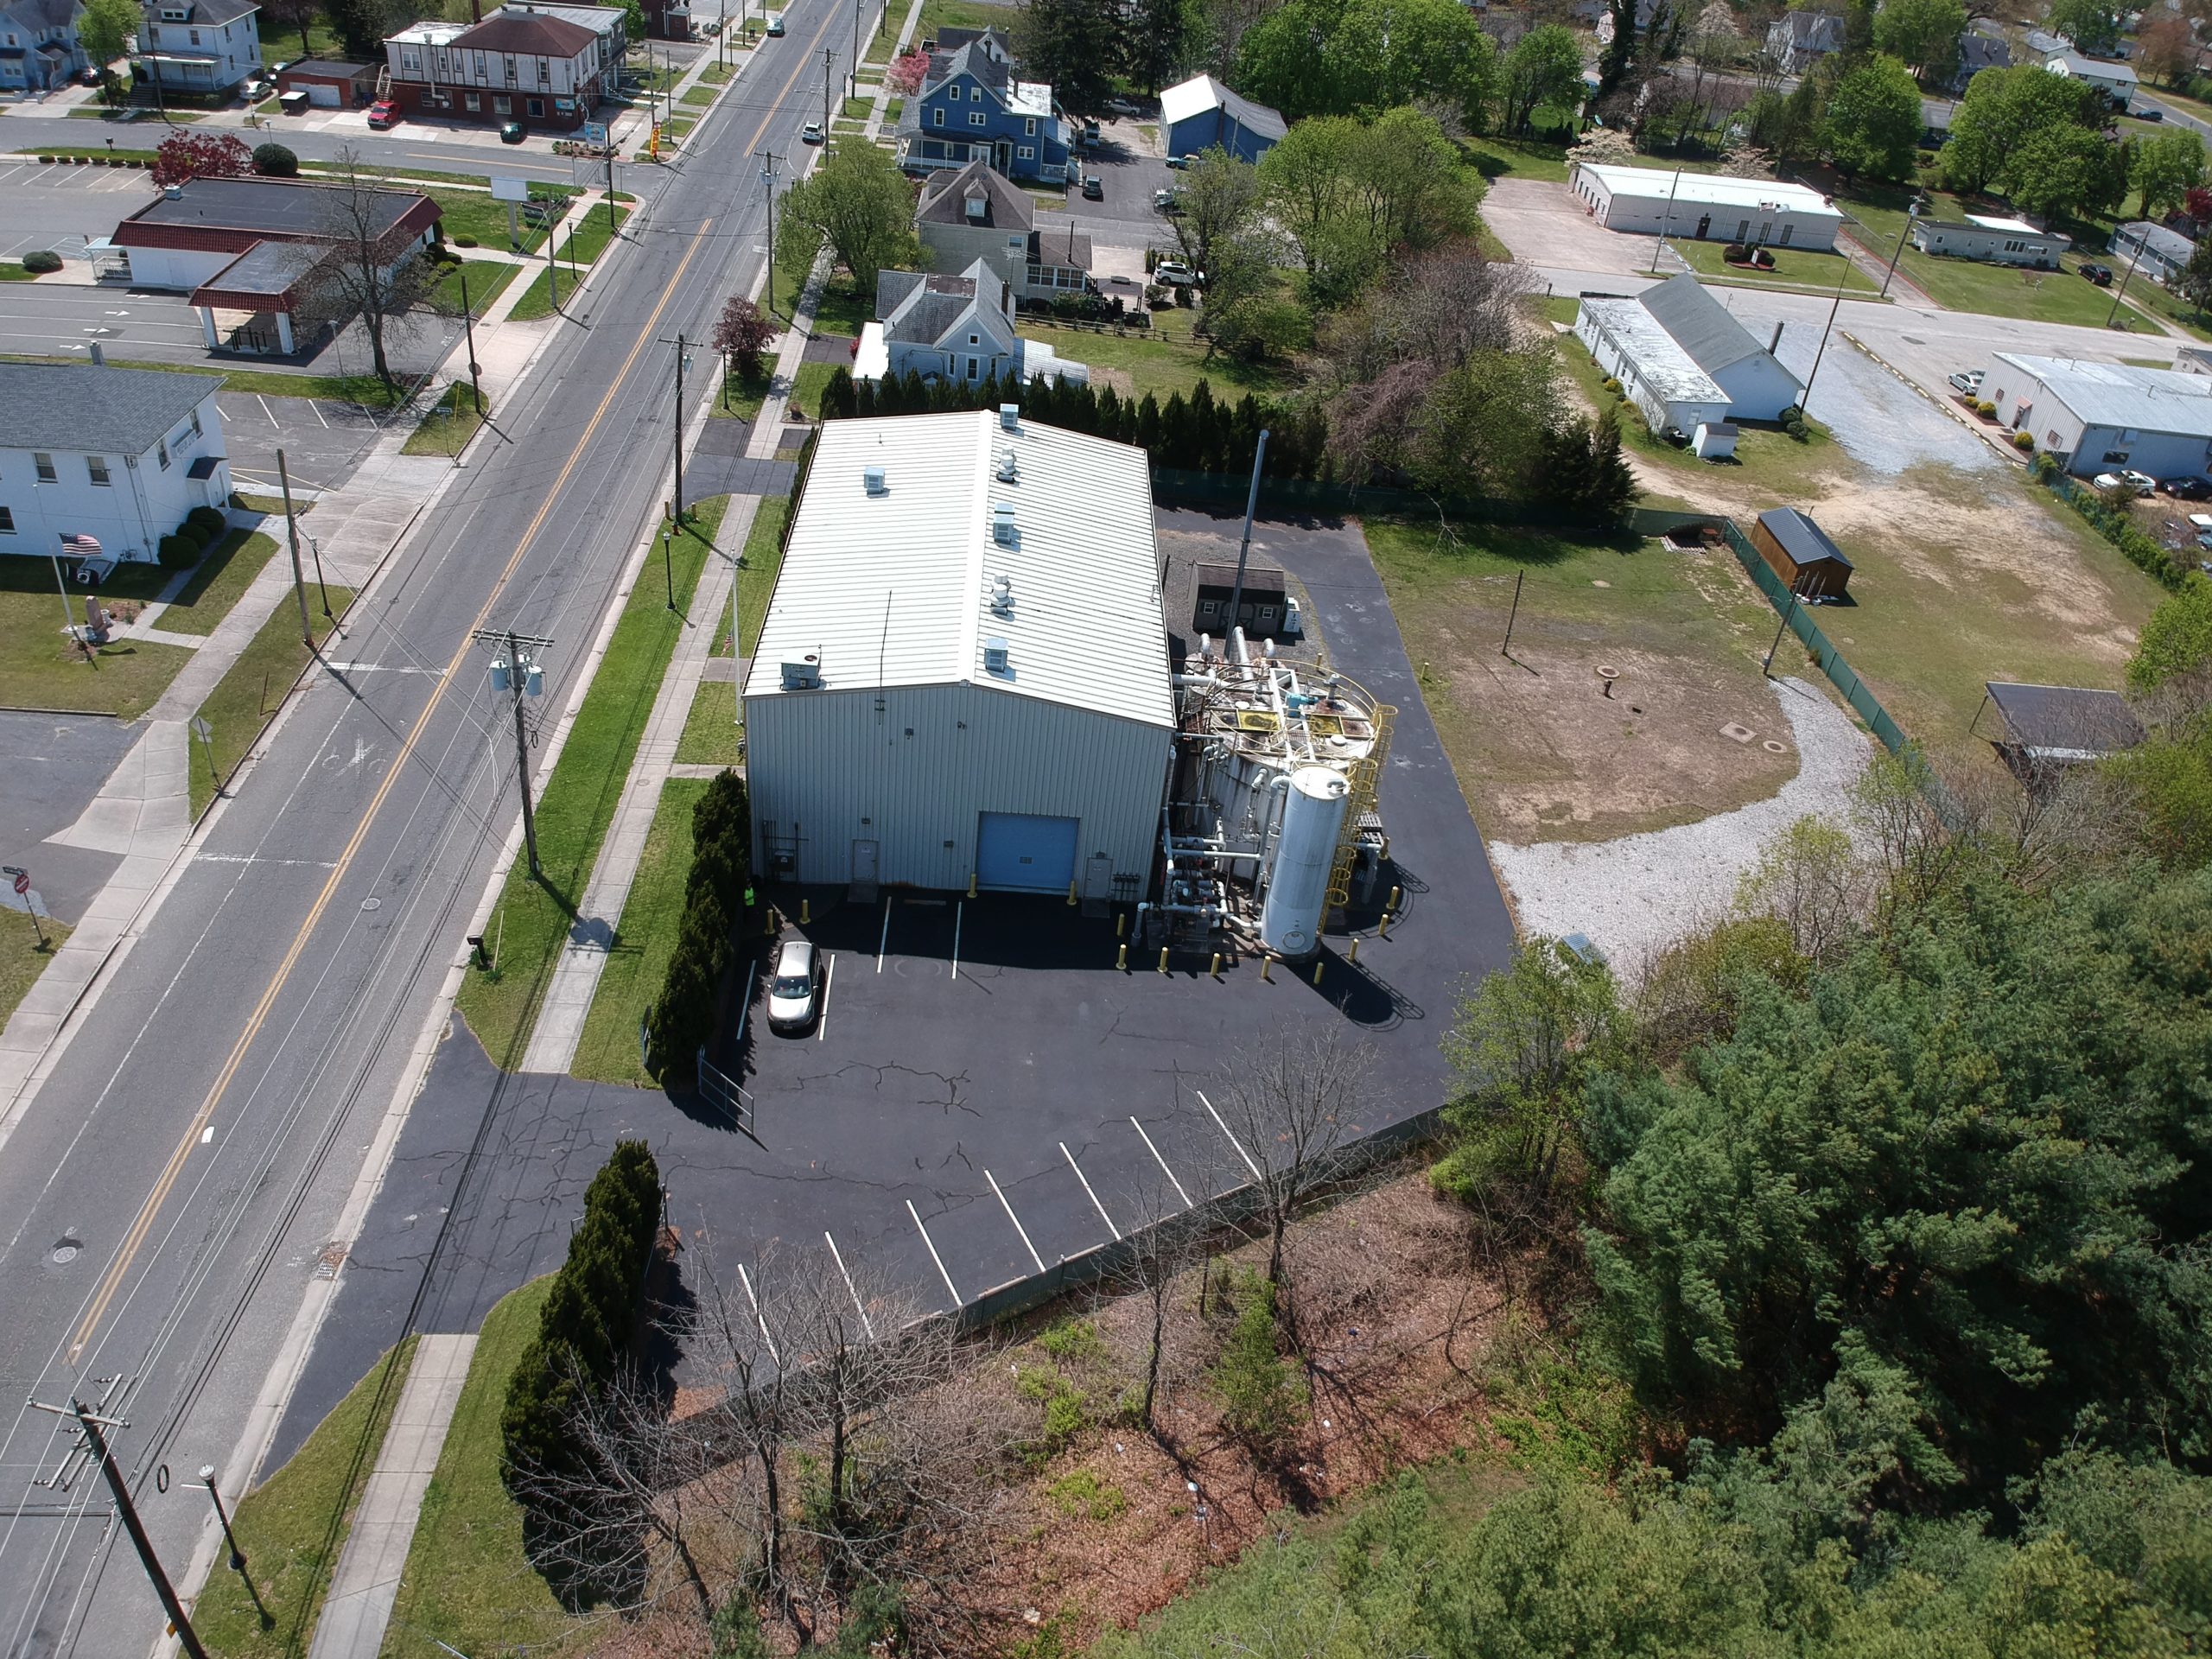
In the middle of this photo is a clothing manufacturer that produced military clothing in a residential and industrial suburb area of New Jersey. The residential homes can be seen in this photo. It also proves that it is a residential area considering the photo captures it from a high elevation from the sky. This picture is accompanied with bright sunshine. The green trees in the photo indicate a season of summertime. It is also backed with local residential homes next to the facility. In addition, it also depicts a two main street and a parking lot for the company’s employees to park their cars.
South Jersey Clothing Company (Federal EPA 1997)
This is the front and back angle picture of South Jersey Clothing Company. Associated with clear blue skies, trimmed green grass and tall Emerald Dark Green Arborvitae Trees. The green trees and the grass are well trimmed around the company, which means that the company is taking care of its presence. Along with, the American Flag hanging from the pole that represents the United States of America. The flag shows the red and white stripes along with blue. The flag is hanging outside the company to salute the military/militants. It can also present that the American Flag hanging outside the company, is also saying nonverbally that they are proud to operate in the United States of America. A security gate is also depicted in the illustration to only allow authorize personal entrance. There is a car parked in the company parking lot representing that someone is inside the facility.
This establishment has been around for many years. This establishment existed from the 1940’s to the late 1990’s. During its production of clothing, it also produced invisible hazardous waste in the residential drinking water.
An investigation was launched at this facility by the US Environmental Protection Agency, New Jersey Department of Environmental Protection Agency, and other local officials went to screen for hazardous conditions at the facility. The hazardous conditions consist of illegal chemical waste of Trichoroethene (TCE) along with Tetrachloroethene (PCE). These are chemicals that clothing manufactures use for cleaning clothes and etc. “A subsequent investigation by NJDEP revealed that water from the resident’s well had levels of Trichoroethene (TCE) as high as 12,000 parts per billion (ppb), along with Tetrachloroethene (PCE) 43,00 ppb” NJDEP. The NJDEP investigation revealed that the company owner from South Jersey Clothing Company dumped hazardous waste methods between 1971 until 1981. “This method included the disposals of waste on the ground in areas around the building and train tracks” NJDEP. This has caused an environmental injustice to the residents and nearby companies located in Minotola NJ. The South Jersey Clothing Company did not have the authorization to drop its wastewater on the soil.
According to the depiction supplied above, this photograph was taken at the location where the company was established. The photos were taken by the New Jersey Department of Environmental Protection and the Federal Environmental Protection Agency prior to the destruction of the company. The photographs were taken for the local politicians, federal politicians, to archive and take to action on the toxic waste cleanup at this facility. The photographs were not posted on the internet and will not be posted on the internet, until further notice. The photographs of the South Jersey Clothing Store are currently being kept confidentially in the United States Environmental Protection Agency and other governmental files. The other documents about the images listed above consists of reports that were typed by state and federal officials’ assessments about the hazardous conditions at the South Jersey Clothing Store site and how to fix it.
Another thing to consider is that this image suggests that South Jersey Clothing Company would only exist in an industrial area of a non-affluent area.
The photo also portrayed what locations a business can operate in. It shows a suburb area of NJ that does not have a high relevance for environmental injustice concerns. The image shows alongside of the company there are residential homes. It also illustrates the social status of the community.
Another point to consider, the photograph shows that a company operated in a non-affluent area. The environmental injustice was placed there because of social status of the residents in this city.
South Jersey Clothing Store was established in Minotola, NJ. Minotola is not one of the top fifteen wealthiest towns of New Jersey. The top fifteen cities of New Jersey consist of ”Millburn, Montgomery, Chatham, West Windsor, Colts Nectk, Glen Rock, Ridge Wood, Westfield, Millstone, Holmdel, Franklin Lakes, Warren, Tenafly, Livingston, & Berkely Heights” (Raychanundri 2019)[1]. South Jersey Clothing Store would not have been able to establish a business in the following towns listed above because of their zoning laws. On the other hand, the city of Minotola, NJ, where South Jersey Clothing Store was consists of a town with low-income poor residents. Clearly, the residents of this area do not have the economic, and social status to stop this company from setting up their establishment there. The Demographics for Minotola, NJ residents where the South Jersey Clothing Store was set up consists of “income level of $28,281 per capita. Education levels in this community is 87.6 % have high school diploma & 9.9 % have a bachelor’s degree or higher” (QuickFacts | Buena Vista township, Atlantic County, New Jersey n.d.)[2].
As a final point, after several attempts from the South Jersey Clothing Store to fix the water pollution problem, they were unsuccessful. Furthermore, “The South Jersey Clothing Company went bankrupt, out of business and longer exists. The long-term remedial action (LTR) ground water extraction and treatment system for the sites are located on the former SJCC Property” (Superfund Five-Year Review Report | South Jersey Clothing Company and Garden State Cleaners Sites 2009)[3]. As a result, the historical site of the South Jersey Clothing Store that was located in Minotola, NJ has been demolished in May 1997.
[1] Raychanundri, Disha. 2019. “The wealthiest towns in N.J., ranked.” nj.com. June 07. Accessed November 07, 2022. https://www.nj.com/data/2019/06/the-wealthiest-towns-in-nj-ranked.html.
[2] n.d. “QuickFacts | Buena Vista township, Atlantic County, New Jersey.” census.gov. Accessed November 07, 2022. https://www.census.gov/quickfacts/fact/table/buenavistatownshipatlanticcountynewjersey.
[3] 2009. “Superfund Five-Year Review Report | South Jersey Clothing Company and Garden State Cleaners Sites.” semspub.epa.gov. September. Accessed November 07, 2022. https://semspub.epa.gov/work/02/105106.pdf.
Data Analysis:
Brief Intro
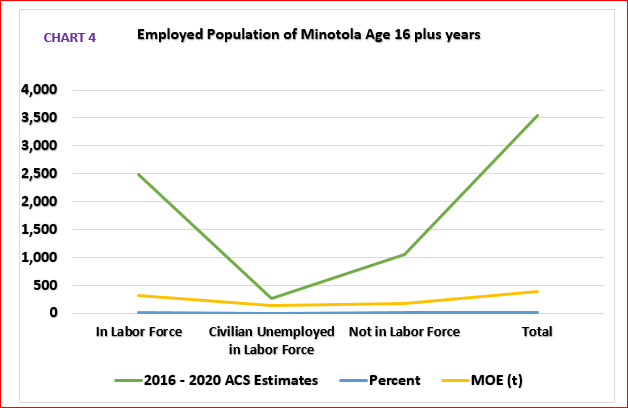
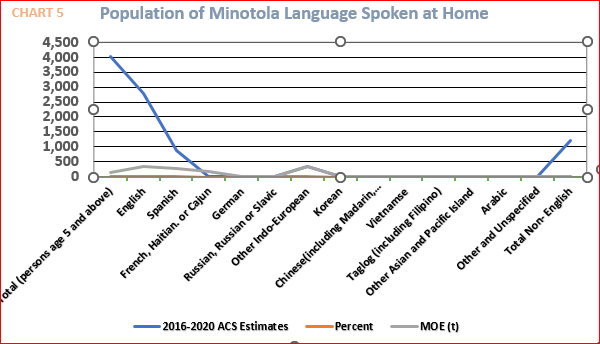
There are five charts listed below. The five charts consist of data background information about Minotola, NJ. I have listed the percentiles, percentages and average means for each description in the charts. Chart 1 consists of an overview of Minotola, NJ . The following charts provide more details for each segment section. The next chart, which is Chart 2 provides information about the race population in this city. Chart 3 entails a more detailed description about the educational attainment from age 25 and up for this city. Chart 4 provides data about the employed population that is age 16 yrs. and up for this location. The last, Chart 5 refers to the languages that are spoken by the citizens of this area. The information that is provided in the charts below was obtained from the United States Environmental Agency, Environmental Justice Screen ACS Summary Report. After obtaining the data, the charts were created to give more information about the city of Minotola, New Jersey.
It is important to provide detailed data analysis with clear chart information. The charts provide important aspects of each segment. It also provides data information on why this community is facing environmental injustice. The key issues of why environmental injustice has occurred in Minotola, NJ is because of the demographic factors, low income, a high unemployment rates, limited English Speaking Households, and High School Education attainment is the highest for the majority of the population.
The initials EJ in the charts listed below stands for environmental justice and the ACS initials stands for actual community survey and actual community survey’s is information that was obtained from the United States Census (EJ Screen Technical Document 2014 2014)[1].
The initials MOE (t) listed in the charts below stands for margin of error.
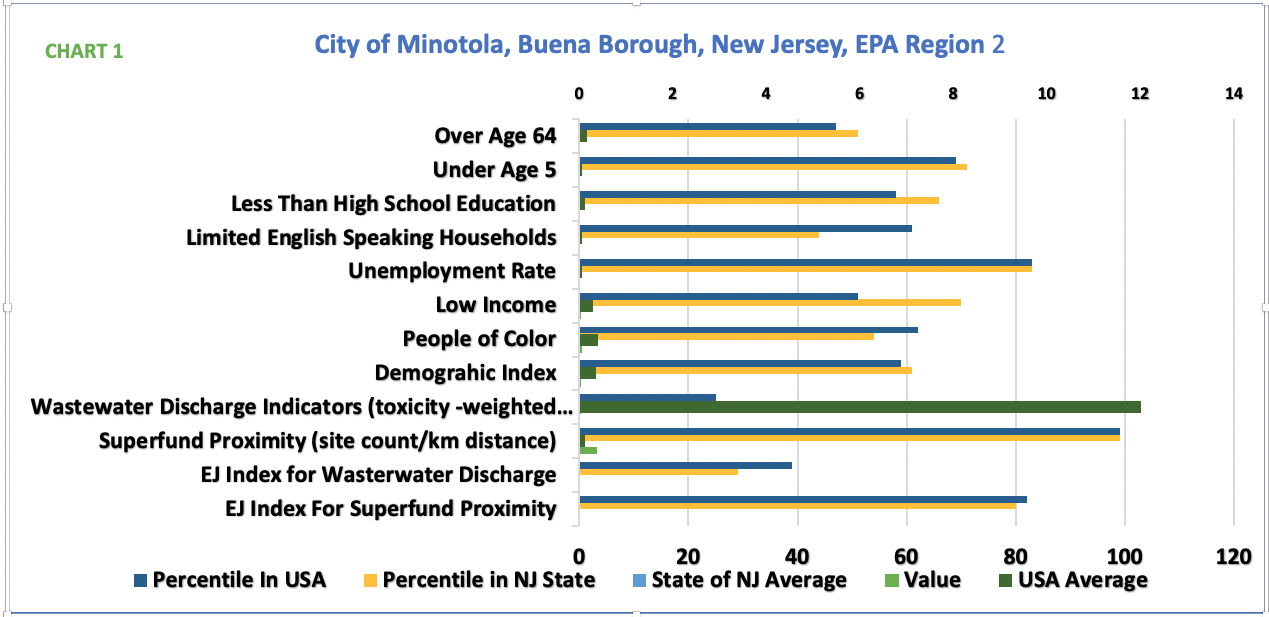
In Chart 1, this chart provides an overview of Minotola, NJ.
Over age 64 “the age of 64 is in the 47th percentile in the USA with 16% USA average” (EJ Screen Acs Summary Report n.d.)[2].This means that it is equal or less than to other age 64 populations in the USA. In the “NJ State, age over 64 is in the 51st percentile and 16% in the NJ State average” (EJ Screen Acs Summary Report n.d.)2. In the State of NJ, the age over 64 is at 16% equal to or higher than 51 percent of the state. “The value for over age is 64 is 15%” (EJ Screen Acs Summary Report n.d.)2.
Under Age 5, “the USA average is 6% and in the 69th percentile” (EJ Screen Acs Summary Report n.d.)2. This means that the under age 5 is equal or less than 69 % of other cities in the United States. The State of New Jersey, under age 5 is in the 71st percentile and 6 % state average” (EJ Screen Acs Summary Report n.d.)2. This means that for the entire State of NJ under age 5 is at 12% or more than 71 percent of children under
age 5 in the State of NJ. It “valued at 7%” (EJ Screen Acs Summary Report n.d.)2.
Less than High School Education, “is in the 58th percentile in the USA and 12% in the USA average” (EJ Screen Acs Summary Report n.d.)2. This
means that 12 % percent is equal or higher than those of 58 % who have less than High School Diploma in the USA. “The State of NJ is in the 66th
percentile and the state average is 10%” (EJ Screen Acs Summary Report n.d.)2 For the State of New Jersey this means that 12% is higher or
equal to 66 % of people with less than High School Diploma in the State of New Jersey. “It is valued at 11%” (EJ Screen Acs Summary Report n.d.)2.
Unemployment rate, “is in the 83rd percentile in the USA and is 5% at the USA average” (EJ Screen Acs Summary Report n.d.)2. This means that 5% percent is equal or higher than 83% of the United States that is unemployed. “The State of NJ is in 83rd percentile and at 6%” (EJ Screen Acs Summary Report n.d.)2. This means that 5 % is equal to or higher than 83% of people who are unemployed. “It is valued at 10%” (EJ Screen Acs Summary Report n.d.)2
Low income, ”is in the 51st percentile USA and is 30% at the USA Average” (EJ Screen Acs Summary Report n.d.). This means that 30% is equal to or higher than 51% of people who are low income in the USA. The State of NJ is in the 70th percentile and is 22 % average” (EJ Screen Acs Summary Report n.d.) This means that 22% is equal to or higher than 70 % of people in the State of NJ who are low income. “It is valued at 28%” (EJ Screen Acs Summary Report n.d.)
People of Color, “is in the 62nd percentile and is at the 40% USA Average” (EJ Screen Acs Summary Report n.d.). This means that 40% of people of color are equal to or higher than 62% of other races that live in the USA. “The State of New Jersey is in the 54th percentile and is at 45% state average” (EJ Screen Acs Summary Report n.d.). This means that 45% is equal to or higher than 54% of other races that live in the State of New Jersey. “It is valued at 43%” (EJ Screen Acs Summary Report n.d.).
Demographic Index, “is in the 59th percentile and is at 35% USA Average” (EJ Screen Acs Summary Report n.d.). This means that 35% is equal to or higher than 59% of the other geographical areas in the USA. “The State of NJ is in the 61st percentile and 33% state average” (EJ Screen Acs Summary Report n.d.). This means that 33% is higher than or equal to 61 % of the geographical area in the State of New Jersey. “It is valued at 35%” (EJ Screen Acs Summary Report n.d.).
Wastewater Discharge (toxicity weighted), “is in the 25th percentile and is at 12% USA Average” (EJ Screen Acs Summary Report n.d.). This means that 12% is higher or equal to 25% of wastewater discharge in USA. The State of New Jersey “is in 15th percentile and is at 0.24 average” (EJ Screen Acs Summary Report n.d.). This means that 0.24 is equal to or higher than 25% of wastewater discharge in the State of New Jersey. “It is valued at 3.8E-05” (EJ Screen Acs Summary Report n.d.)
Superfund (cite count/km distance), “is in the 99th percentile and is at 0.13 USA Average” (EJ Screen Acs Summary Report n.d.). This means that 0.13 percent is equal to or higher than 99% of distance for the Superfund proximity. In the State of New Jersey “it is in the 99th percentile and at 0.45 state average” (EJ Screen Acs Summary Report n.d.). This means that 0.45 percent is equal to or higher than 99% of areas in the New Jersey. “It is valued at 3.2” (EJ Screen Acs Summary Report n.d.).
EJ Index for wastewater discharge, “is at 39th percentile in the USA and is at the 29th percentile for the State of New Jersey” (EJ Screen Acs Summary Report n.d.). This means that the State of NJ is equal to or higher than the 39% of the US wastewater discharge.
EJ index for Superfund Proximity, “is 82nd percentile for the USA and is at the 80th percentile for the State of New Jersey” (EJ Screen Acs Summary Report n.d.). This means that the state of NJ is at 80% equal to or higher than the 82% of proximity for Superfund in the US.
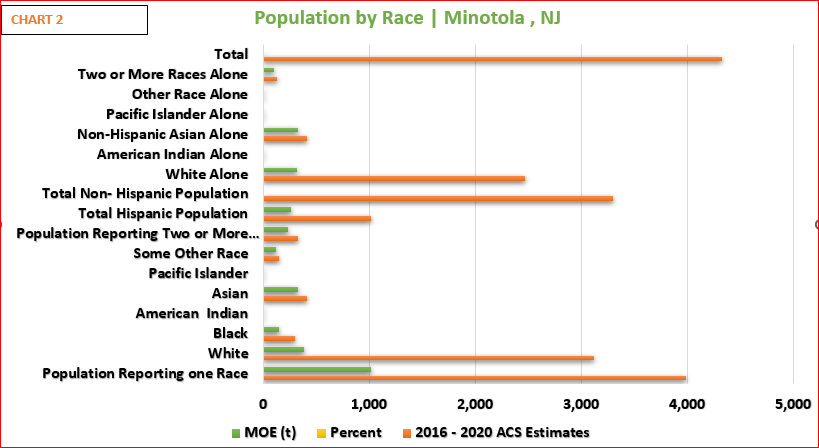
Total Population, ACS Estimates 4,323, Percent 100%, MOE (t) 417 2
Two or More Races Alone, ACE Estimates 135, Percentage 3%, MOE (t) 105
“Other race alone, ACE Estimates 0, Percentage 0, MOE (t) 13
Pacific Islander alone, ACE Estimates 5, Percentage 0, MOE (t) 13
Non Hispanic-Asian alone, ACE Estimates 416, Percentage 10, MOE (t)329
American Indian alone, ACE Estimates 0, Percentage 0, MOE (t) 13
Black Alone, ACE Estimates 281, Percentage 7, MOE (t) 153
White alone, ACE Estimates 2,467, Percentage 57, MOE (t) 315
Total Non Hispanic Population, ACE Estimates 3,304, Percentage , MOE (t)
Population Reporting two or more races, ACE Estimates 333, Percentage 8, MOE (t) 233
Some other race, ACE Estimates 146, Percentage 3, MOE (t)233
Pacific Islander, ACE Estimates 5, Percentage 0, MOE (t) 13
Asian, ACE Estimates 416, Percentage 10, MOE (t) 329
American Indian, ACE Estimates 0, Percentage 0, MOE (t) 13
Black, ACE Estimates 305, Percentage 7, MOE (t) 153
White, ACE Estimates 3,118, Percentage 72, MOE (t) 388
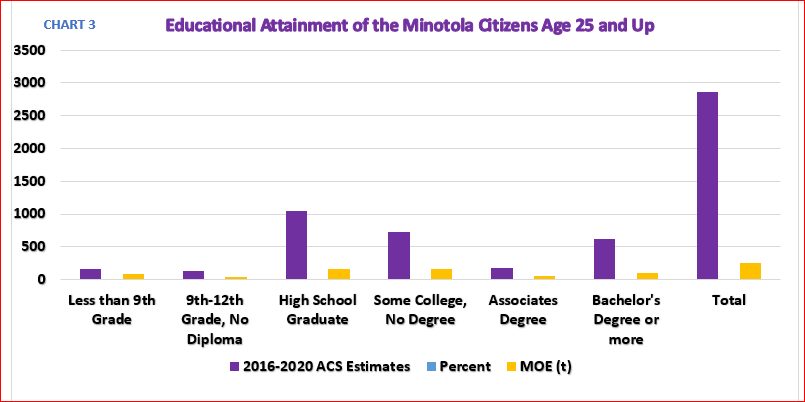
Population Reporting one race, ACE Estimates 3,990, Percentage 92, MOE (t)1,020” (EJ Screen Acs Summary Report n.d.Less than 9th grade, ACS Estimates 167 , Percentage 6, MOE (t) 251
9th – 12th grade, no diploma, ACS Estimates 137, Percentage 5, MOE (t) 94
High School Graduate, ACS EstimatPentage 36, MOE (t) 168
Some College, No Degree, ACS Estimates 726, Percentage 25, MOE (t) 168
Associates Degree, ACS Estimates 178, Percentage 6 , MOE (t) 64
Bachelor’s Degree or more, ACS Estimates 614, Percentage 21, MOE (t)106
Total, ACS Estimates 2,864, Percentage 100, MOE (t)251” (EJ Screen Acs Summary Report n.d.)
“In Labor Force, ACS Estimates 2,487, Percentage 70, MOE (t) 314
Civilian Unemployed in Labor Force, ACS Estimates 259, Percentage 7, MOE (t) 133
Not in Labor Force, ACS Estimates 1,049, Percentage 30, MOE (t) 175
Total, ACS Estimates 3,536, Percentage 100, MOE (t) 380” (EJ Screen Acs Summary Report n.d.)2
“Total (persons ages 5 and above), ACS Estimates 4, 011, Percentage 100, MOE (t) 135
English, ACS Estimates 2,789, Percentage 70, MOE (t) 357
Spanish, ACS Estimates 863, Percentage 22, MOE (t) 288
French, Haitian, or Cajun, ACS Estimate 0, Percentage 0, MOE (t) 186
German or other West Germanic, ACS Estimates 0, Percentage 0, MOE (t) 186
Russian, Polish, or Other Slavic, ACS Estimates 21, Percentage 1, MOE (t) 25
Other Indo-European, ACS Estimates 328, Percentage 8, MOE (t) 339
Korean, ACS Estimates 0, Percentage 0, MOE (t) 13
Chinese (including Mandarin, Cantonese), ACS Estimates 0, Percentage 0, MOE (t) 13
Vietnamese, ACS Estimates0, Percentage 0, MOE (t) 13
Tagalog (including Filipino), ACS Estimates 8, Percentage 0, MOE (t) 14
Other Asian and Pacific Island, ACS Estimates 2, Percentage 0, MOE (t) 6
Arabic, ACS Estimates 0, Percentage 0, MOE (t) 13
Other and Unspecified, ACS Estimate 0, Percentage 0, MOE (t) 13
Total Non-English, ACS Estimates 1,222, Percentage 30, MOE (t) 382 “ (EJ Screen Acs Summary Report n.d.)2
In conclusion, Minotola NJ is a well diverse population. It has many people living there from different backgrounds. There are different languages that are spoken in Minotola, which contributes to the diversity in this particular region. However, English is the main language that is spoken. Spanish is the second highest language that is spoken in Minotola and the third language consist other Indo European. On the contrary, “there is 9% or more that dose not speak English Language very well in Minotola” (EJ Screen Acs Summary Report n.d.).
In addition, there are high unemployment rates, low educational attainments, and low income people that reside in this region. “The unemployment rate consists of 30% not in the labor force and 7 % unemployed in the labor force. The educational attainments are low in this city because only 36% have a high school diploma, and only 27% have a college degree. The income is also very high due to the fact that 18% income is $25,000 to $50,00 and 45% is at $75,000” (EJ Screen Acs Summary Report n.d.)
As a final point, Minotola is an under represented community due to the fact that it was placed on the National Priorty List to clean up waste hazards by United States Environmental Protection Agency. Minotola has experienced environmental injustice because of the wastewater pollution. The demographics correlate why this popultion occurred in Minotola. It consists of low income level, high unemployment rates, and low educational attainments. All of this factors contributes to why Minotola faced environmental pollution.
[1] 2014. “EJ Screen Technical Document 2014.” epa.gov. April 04. Accessed November 14, 2022. https://www.epa.gov/ejscreen/technical-documentation-ejscreen.
[2] n.d. “EJ Screen Acs Summary Report.” ejscreen.epa.gov. Accessed November 11, 2022. https://ejscreen.epa.gov/mapper/demogreportpdf.aspx?report=acs2020.
2 n.d. “EJ Screen Acs Summary Report.” ejscreen.epa.gov. Accessed November 11, 2022. https://ejscreen.epa.gov/mapper/demogreportpdf.aspx?report=acs2020.
2 n.d. “EJ Screen Acs Summary Report.” ejscreen.epa.gov. Accessed November 11, 2022. https://ejscreen.epa.gov/mapper/demogreportpdf.aspx?report=acs2020.
2 n.d. “EJ Screen Acs Summary Report.” ejscreen.epa.gov. Accessed November 11, 2022. https://ejscreen.epa.gov/mapper/demogreportpdf.aspx?report=acs2020.
2 n.d. “EJ Screen Acs Summary Report.” ejscreen.epa.gov. Accessed November 11, 2022. https://ejscreen.epa.gov/mapper/demogreportpdf.aspx?report=acs2020.
2 n.d. “EJ Screen Acs Summary Report.” ejscreen.epa.gov. Accessed November 11, 2022. https://ejscreen.epa.gov/mapper/demogreportpdf.aspx?report=acs2020.
Oral Interviews:

